Greyhound Form Analysis: Trap Stats, Sectional Times and the Data That Wins
Best Greyhound Betting Sites – Bet on Greyhounds in 2026
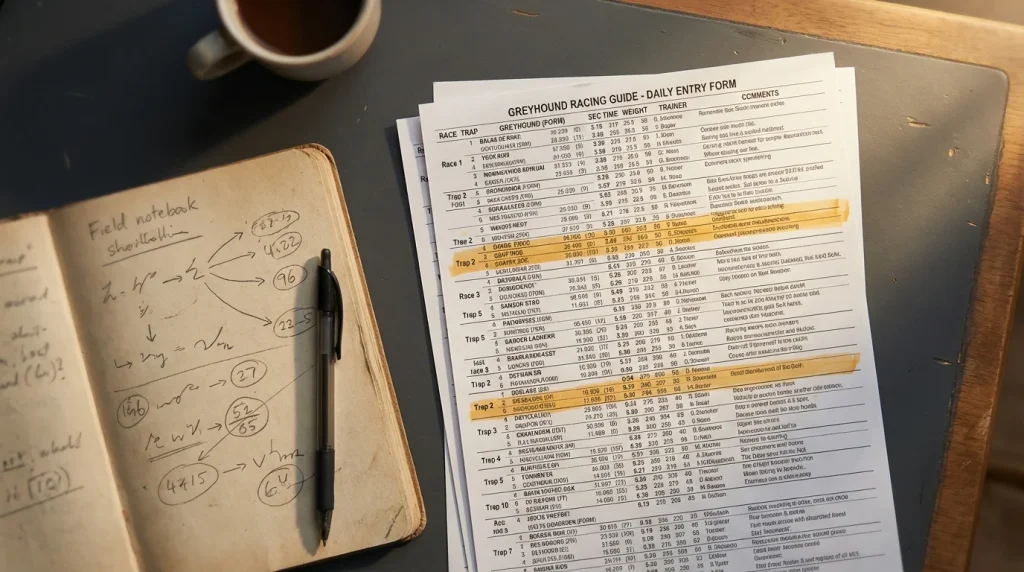
Loading...
Data-Driven Doesn’t Mean Complicated
Form analysis in greyhound racing boils down to three questions: how fast, from where, and against whom. Every other metric — trap statistics, sectional times, grade movements, trainer patterns, weight trends — feeds into one or more of those three. The punter who can answer them accurately for six dogs in a race has a structural advantage over the one relying on instinct, tips, or favourite status. That advantage compounds over time, race by race, card by card.
The phrase “data-driven” has acquired a slightly pretentious quality in recent years, as though you need a degree in statistics and a subscription to a proprietary algorithm before you can study a racecard properly. You do not. The data in greyhound racing is publicly available, relatively simple, and covers a manageable number of variables. There are six dogs. Each has a trap draw, a set of recent form lines, a trainer, a weight, and a grade. The track has a circumference, a distance, and a published going. None of this requires complex modelling. What it requires is systematic reading and the discipline to act on what the data shows rather than on what you feel.
This guide covers the six core components of greyhound form analysis: trap statistics and when they matter, sectional times as a measure of early speed, grade movements as a signal of improving or declining ability, trainer and kennel patterns, weight trends and seasonal form, and the process of combining these elements into a coherent selection method. Each section works independently — you can sharpen your understanding of any single factor without mastering the others — but the power is in the combination. A dog with favourable trap stats, a strong sectional time, and a grade drop is a different proposition from one that merely has a good finishing position in its last race.
Trap Statistics: What the Numbers Really Say
Trap bias exists at every UK track — the question is whether it’s significant enough to bet on. At most GBGB venues, trap one has a higher win percentage over shorter distances than trap six. This is a function of geometry: on a right-handed circuit, the inside dog has the shortest distance to the first bend. But the size of the advantage varies dramatically between tracks and distances, and treating all trap statistics as equivalent is a common analytical error.
Win Rates by Trap Across UK Tracks
Over a large sample of races at a typical compact track — say, one thousand races over the standard sprint distance — trap one might win around twenty to twenty-two percent of the time, compared to a random expectation of 16.7 percent. That is a meaningful edge. Trap six, meanwhile, might win twelve to fourteen percent. The middle traps — two through five — usually cluster between fifteen and nineteen percent, with trap two often benefiting from proximity to the rail and trap five occasionally profiting from clear running on the outside.
At larger tracks with wider circumferences and longer runs to the bend, the spread narrows. Trap one might win eighteen percent against trap six’s fifteen percent — still an advantage, but a smaller one. The run to the first bend is the critical variable. A short run forces the field into the bend before positions have settled, magnifying the inside-draw advantage. A longer run allows more natural sorting, which dilutes it.
The practical takeaway: always check trap statistics for the specific track and distance you are betting on. National averages are misleading. Crayford’s trap-one advantage over 380 metres was substantially larger than the UK average because of its exceptionally tight circuit. That figure is useless at Towcester. Track-specific data, published by GBGB and available through form databases, is what matters.
When Trap Advantage Disappears
Over longer distances, trap advantage diminishes significantly. A 714-metre race at a 334-metre circuit covers more than two full laps, which means the field passes through four-plus bends. By the time the dogs reach the second lap, the initial trap positions have long been abandoned. The race has become a test of stamina, mid-race pace, and the ability to find running room — not a test of who stood closest to the inside rail at the start.
Hurdle races add another variable. The obstacles disrupt early pace and create more opportunities for position changes, which further reduces the predictive power of trap draw. In any race where the first bend is not the decisive moment — stayers, hurdle events, marathon distances — trap statistics should be downweighted in your analysis. Not ignored entirely, because the initial break still affects early positioning, but given less prominence than in a sprint where the first bend determines the outcome.
Weather and going conditions also interact with trap bias. On heavy going, the inside rail can become churned up from repeated races, reducing the advantage of running there. Some tracks maintain the rail better than others. On very fast going, the marginal benefit of the shorter distance on the inside is amplified because time differences translate into larger distance margins. These are second-order effects, but for punters betting on marginal decisions, they matter.
Sectional Times: The Early Speed Metric
A dog’s split to the first line tells you more than its finishing time. The sectional time — measured from the traps to a timing point partway through the race, usually near the first bend — quantifies a dog’s early pace. In a sport where the first bend is frequently the decisive moment, knowing which dog breaks fastest from its drawn trap is the single most valuable piece of form data available.
Sectional times reveal what finishing positions obscure. A dog that finishes third with a 4.38-second split was almost certainly leading or challenging at the first bend, then lost ground through crowding, checking, or fading stamina. A dog that finishes second with a 4.55 split was always in the rear half of the field and made up ground late. Both finished within a length of each other, but their races were fundamentally different. The fast-splitting dog is the better prospect for a race where it draws a favourable trap and gets a clean break. The slow-splitting dog needs trouble ahead to prosper.
When comparing sectional times, always control for track and distance. A 4.40 split over 380 metres at a tight track is not the same as a 4.40 split over 400 metres at a galloping circuit. The distance to the timing beam differs, the bend angles differ, and the relative importance of the split in the overall race differs. Compare splits within the same track, distance, and ideally the same meeting conditions. Cross-track comparisons are useful only as rough indicators.
Sectional time trends across a dog’s last three or four runs are particularly informative. A dog whose splits are quickening — say, 4.52, 4.48, 4.44 — is improving its trap break, which often precedes a run of stronger results. The dog is sharpening physically or being trained with a focus on early speed. Conversely, deteriorating splits suggest declining fitness, injury, or simply a dog moving past its peak. These trends may not yet be reflected in finishing positions, because a dog can compensate for a slower break with stamina or class against weaker opposition. But the slip in split time is an early warning signal that the results will eventually follow.
For race-shape analysis, compare the splits of all six runners. If one dog’s sectional time is clearly faster than the rest from its drawn trap, that dog is likely to lead at the first bend. If two dogs have similar fast splits from adjacent traps — say traps three and four — the probability of crowding increases. These projections are not certainties, but they transform random six-dog races into structured scenarios that can be assessed and priced.
Grade Movement as a Form Signal
A dog dropping from A2 to A4 isn’t declining — it might be the best bet on the card. Grade movement is one of the simplest and most underused form signals in greyhound betting. The UK grading system places dogs in categories from A1 (highest at most tracks) downward, based on recent performances. Dogs that win or place consistently move up in grade; those that finish poorly move down. The movement itself tells you something about the dog’s recent trajectory, but it also creates specific betting opportunities that the market often misprices.
A dog dropping in grade is running against weaker opposition. Its previous results at a higher grade — finishing third or fourth in A2 — may look mediocre, but that level of performance could translate to winning or placing at A4. The key is to check whether the downgrades were caused by genuine poor form or by circumstance. If the form comments show crowding, checking, or unfavourable draws, the dog may have maintained its ability while accumulating the poor finishing positions that trigger a grade drop. That combination — underlying ability plus an artificially lowered grade — is exactly where value lives.
Grade climbers present the opposite scenario. A dog moving from A6 to A4 to A3 is being promoted because it has been winning, which means each successive grade puts it against better competition. The question is whether the winning form was achieved on merit — genuine speed and class — or through favourable draws and weak opposition. A dog that won at A5 from trap one with a fast split on a tight track may struggle at A3 from trap four at the same venue. The form figures say “winner” but the context says “conditional.”
Open races sit above the grading ladder entirely and feature the strongest dogs regardless of grade. A dog that has been competing in open company and drops back into graded racing carries significant class advantage, even if its open-race form reads as mid-field finishes. The reverse — a graded dog stepping up to open class for the first time — is often overbet by punters who focus on its win record without accounting for the jump in opposition quality.
The practical application is straightforward: always note the grade trajectory alongside the finishing positions. A sequence of 3-4-3 across three races tells you nothing useful in isolation. A sequence of 3-4-3 where the grades were A2, A1, and A2 tells you the dog is competing at a consistently high level. The same sequence at A6, A5, and A5 tells a very different story.
Trainer and Kennel Form Patterns
Some trainers peak in winter. Others dominate sprints. The patterns repeat. Trainer form is an underappreciated variable in greyhound betting, partly because the sport is perceived as being about the dogs rather than the humans. But trainers control preparation, fitness, trial scheduling, and the decision of which races to enter their dogs in. A trainer in form — one whose kennel is producing winners at above their historical strike rate — is likely doing something right in training and race selection. A trainer whose runners are consistently underperforming may be dealing with illness in the kennel, suboptimal preparation, or simply a weaker group of dogs than usual.
Track-specific trainer data is the most useful metric. Some trainers have a strong record at particular venues and weaker records at others. This can reflect familiarity with the track’s characteristics, the distance menu suiting their dogs’ profiles, or simply the logistics of transport — a trainer based near Hove might travel less happily to northern tracks, and the dogs may race less effectively after a long journey. Before the closure, Crayford had a small group of resident trainers whose dogs performed disproportionately well there: Julie Luckhurst, Gemma Davidson, and others who knew the track’s idiosyncrasies intimately.
Seasonal patterns are also worth tracking. Some kennels produce their best dogs in the spring and summer, when training conditions are optimal and dogs reach peak fitness. Others, particularly those in the north, may perform better in cooler months when the sand runs slower and stamina becomes more important. These patterns are not universal rules — they are tendencies within specific kennels — but they recur often enough to be useful. A trainer whose last ten runners have included four winners is a trainer whose dogs deserve extra attention on the racecard, regardless of whether you can explain the reason.
For punters who previously focused on Crayford’s small training community, the transition to broader UK racing means learning a larger cast of trainers. Start with the ones whose dogs appear most frequently at your new target track, and build a basic log: runs, wins, places, strike rate. Over a few weeks, the patterns emerge. Over a few months, they become a genuine edge.
Weight Trends and Seasonal Form
A kilogram swing in weight between races can mean fitness, injury or peak condition. Greyhound racecards list each dog’s weight in kilograms, and the figure from previous races is included in the form lines. Most punters glance at the number and move on. More disciplined analysts track the trend across three or four runs, looking for patterns that signal changes in the dog’s physical state.
A dog maintaining a consistent weight across multiple starts — say 32.0kg, 32.1kg, 31.9kg, 32.0kg — is in a stable condition. The variation is within normal range, and there is no signal worth acting on. A dog showing a steady decline — 33.0kg, 32.5kg, 32.0kg, 31.5kg — across four races over six weeks might be losing condition through overracing, inadequate recovery, or an underlying health issue. Conversely, a gradual weight increase in a young dog — from 30.5kg to 31.5kg over three months — could indicate physical maturation rather than loss of fitness.
Sudden changes are more noteworthy than gradual ones. A dog that raced at 32.0kg for five consecutive starts and then appears at 31.0kg has lost a kilogram quickly. That might mean the trainer has put the dog through a specific preparation — stripping it down for a sprint race, for example — or it might indicate that something is wrong. Without insider knowledge, you cannot determine the cause from the weight alone. What you can do is flag the anomaly and factor it into your overall assessment. A sharp weight drop combined with declining split times is a strong warning. A sharp weight drop combined with a move to a shorter distance and a strong morning trial time might be a deliberate preparation choice.
Seasonal form patterns overlay the weight data. Most UK greyhounds race year-round, but their performance levels fluctuate with the seasons. Some dogs run faster in summer on firm, dry sand. Others cope better in winter when cooler temperatures suit their build. Trainers manage this by adjusting racing schedules — resting dogs during their weaker season and targeting them at competitions during their peak months. For the bettor, the useful question is whether this dog is currently in its strong phase or its weak one. Form from the previous corresponding season — last winter’s results for a dog racing this winter — can be more predictive than form from the immediately preceding months if those months fell during the dog’s off-peak period.
Neither weight nor seasonal form should be the primary basis for a selection. They are refinement tools — factors that adjust your confidence up or down after you have assessed the more fundamental variables of speed, trap draw, and grade. A dog with the best sectional time and a favourable draw does not become a poor selection because it has lost 300 grams since its last run. But if your analysis leaves you choosing between two dogs with similar form, weight stability and seasonal fitness can be the tiebreaker.
Building a Selection Process
Step one: filter by trap. Step two: rank by sectional speed. Step three: cross-check the grade. That three-step summary is deliberately reductive — the full process involves more nuance — but it captures the hierarchy of decisions that form analysis should follow. Each step narrows the field. By the end, you should have one or two dogs that merit further investigation, and four or five that can be eliminated.
Begin with the trap draw. Check the track-specific trap statistics for the distance being raced. If trap one wins twenty-two percent of the time over this distance and trap six wins twelve percent, factor that into your baseline expectations. A dog in trap one starts with a measurable structural advantage. That does not mean it will win — form, fitness, and race shape still apply — but it means the dog requires less justification to be included in your shortlist than one drawn outside.
Next, compare sectional times. Pull the last three splits for each dog at this distance and track (or at a comparable track if the dog is racing at a new venue). Identify the fastest splitter from each trap. If the fastest overall split belongs to the dog in trap one, you have a strong candidate. If the fastest split belongs to the dog in trap five, there is a tension between speed and geometry that requires further thought. Look for dogs whose splits are improving across their last three runs — the trend matters as much as the absolute number.
Cross-check the grade. Is this dog running at, above, or below its demonstrated ability level? A dog dropping two grades with clean form at the higher level is a stronger proposition than one steady in its current grade. A dog climbing in grade may be overextended. The grade context frames the finishing positions: a third at A2 is a stronger piece of form than a first at A7, and a dog whose A2 thirds are consistently accompanied by fast sectional times is potentially underpriced in an A4 race.
Now layer in the secondary factors. Check the trainer’s current form — is the kennel running hot or cold? Check the weight — is it stable, or has there been a notable change? Read the racecard comments from the last three runs — are the finishing positions genuine reflections of the dog’s ability, or were they distorted by crowding, slow traps, or interference? Each factor either confirms or challenges your initial assessment based on trap, speed, and grade.
Finally, map the likely race shape. Based on the splits and trap draws of all six runners, project who will lead at the first bend, who will sit behind, and where crowding is most likely. This projection tells you whether the race is likely to play to your selection’s strengths or expose its weaknesses. A confirmed front-runner drawn on the inside with the fastest split in a race where no other fast breaker is drawn nearby has an ideal scenario. The same dog in a race with two other fast breakers drawn adjacent has a crowding risk that the odds may not reflect.
The entire process takes less than five minutes per race with practice. It does not guarantee winners — nothing does — but it systematically eliminates bad bets and highlights the selections where your analysis gives you the best chance of finding value.
The Spreadsheet Won’t Pick the Winner — But It Narrows the Field
Data removes bad bets. Judgement picks the good ones. The distinction matters because form analysis is not a prediction engine — it is a filtration system. No amount of trap statistics, sectional times, or grade tracking will tell you with certainty which dog crosses the line first. What they will tell you is which dogs have the strongest case, which have hidden excuses in their form, and which are carrying a price that doesn’t reflect their actual chance.
The six form factors covered in this guide — trap draw, sectional speed, grade movement, trainer patterns, weight trends, and seasonal form — are available to any punter willing to spend fifteen minutes with a racecard instead of five seconds with the favourite’s name. The data is not proprietary. It is published on every card, archived in every results database, and updated after every meeting. The edge does not come from having access to exclusive information. It comes from reading the same information more carefully than the majority of the market.
Greyhound racing’s smaller field sizes make form analysis more tractable than in horse racing, where fourteen-runner handicaps can defeat even the most diligent student. Six dogs, six sets of form, six trap draws. The combinations are manageable. The patterns are identifiable. The question is always whether you are disciplined enough to follow the process rather than shortcutting to a gut feeling.
The sport has lost venues — Crayford among them — and the circuit continues to contract. But the racing that remains produces honest data at honest tracks, and the punter who applies systematic analysis to that data has an advantage that no closure can take away. Build the process, trust the numbers when they are clear, accept uncertainty when they are not, and let the market pay you for the difference.