Crayford Greyhound Trap Draw Statistics Explained
Loading...
Trap 4 produced more winners than any other box at Crayford — and the margin wasn’t small. Over a dataset of 1,357 graded races tracked in 2019, the black-jacket position won 19% of all contests. In a perfectly balanced six-dog field, every trap would account for roughly 16.7% of victories. A two-plus percentage point swing sounds modest until you compound it across an entire year of racing. Then it stops being a curiosity and starts being a structural edge embedded in the track’s geometry. Get more race analysis at crayfordgreyhound.
Crayford’s 334-metre right-handed sand circuit was never neutral ground. The 77-metre run from traps to first bend — short by UK standards — turned early positioning into the decisive factor in a majority of races. Dogs drawn in boxes that gave them a clean route to the racing line held a built-in advantage before a single stride was taken. That advantage showed up in the results consistently, season after season. It was not a secret. Trainers knew it, racing managers graded around it, and bookmakers priced it in — to varying degrees. But casual punters frequently treated trap draw as an afterthought, something to glance at after studying the form. At Crayford, the trap was the form.
Since the stadium closed in January 2025, this data no longer updates. The numbers are frozen. But that is precisely what makes them worth studying. A closed dataset is a clean dataset: no new outliers to muddy the trends, no pending meetings to wait for, no upcoming results to speculate about. For anyone reviewing Crayford’s archive — whether for research, out of curiosity, or to understand how trap bias functions at tight UK circuits — the statistics from this venue remain one of the clearest demonstrations of how starting position shapes outcomes in greyhound racing.
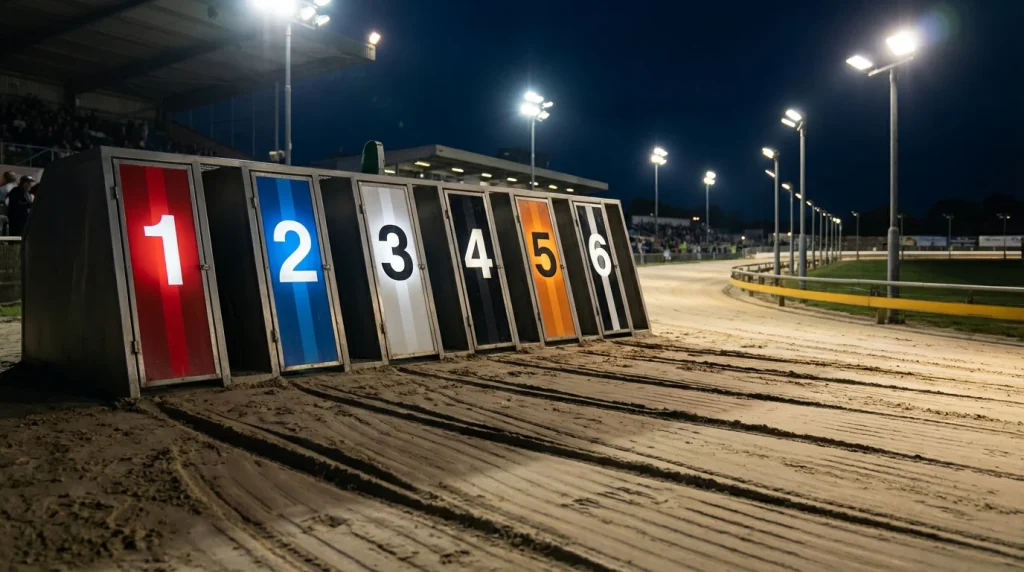
Historical Win Rates by Trap
In 1,357 races tracked in 2019, the distribution was anything but even. Trap 4 led the table at 19.0% of all victories, followed by trap 6 at 17.8% and trap 1 at 17.1%. The middle of the pack — traps 2 and 3 — hovered close to the expected 16.7%, neither favoured nor penalised in a meaningful way. And then there was trap 5, stuck at the bottom on approximately 14.3%. A five-percentage-point gap between the best and worst starting positions across well over a thousand races is not noise. It is pattern.
Why trap 4? The answer sits in Crayford’s geometry. On a right-handed circuit, the inside rail is the shortest route through every bend. Trap 1 sits against that rail, which should theoretically give it the biggest advantage — and it does, on ground covered. But the 77-metre run to the first turn creates a different problem for the inside box. Dogs from traps 2 and 3 break on an angle that naturally cuts across the trap 1 runner’s path. At Crayford’s compressed distance, this cross-traffic arrived before the trap 1 dog had time to establish position. Trap 4, by contrast, sat one box further from the congestion zone. A clean break from the black jacket gave the dog a direct line to the first bend without the immediate threat of being crowded by inside runners. Trap 6 benefited from a similar logic on the opposite side — open air to its outside, no traffic to deal with immediately — though it paid a small price in extra ground on the bends.
Trap 5 had the worst of both worlds. It was too far from the rail to save ground through the bends and too close to the wide-running trap 6 dogs to have a clear outside route. A trap 5 runner that didn’t lead into the first bend had nowhere comfortable to settle. It was either squeezed towards the rail by wide runners or pushed wide itself, losing ground on every turn. Over hundreds of races this positional disadvantage compiled into a measurably lower win rate.
It’s important to note that these figures reflect graded racing — the standard weekly meetings where the racing manager assigns traps based on each dog’s running style. Railers go inside, wide runners go outside, middle runners fill the centre. The grading process should, in theory, reduce trap bias because every dog is placed where its style suits. That the bias persisted regardless tells you something about the track itself. Crayford’s geometry created advantage that existed independently of how well the dogs were placed.
Open races, where trap draws were often random or less carefully calibrated, could produce different distributions. But Crayford ran far more graded meetings than opens, so the aggregate data was weighted heavily towards the everyday cards. If you were betting at Crayford regularly — Friday evenings, Saturday mornings, midweek matinees — the graded-race statistics were your working numbers.
One caveat worth repeating: a 19% win rate does not mean the trap 4 dog wins one in five races like clockwork. It means that over a sufficiently large sample, trap 4 accounts for roughly one in five victories. On any given card of twelve races, trap 4 might win five times or none. The edge is statistical, not mechanical. It tells you where to look, not what to back.
How Distance Changed Trap Bias
Crayford’s five race distances — 238m, 415m, 592m, 769m and 946m — each reshaped the trap-draw advantage in ways that the headline win-rate table obscures. The shorter the race, the more decisive the start. The longer the race, the more the advantage diluted — but never fully disappeared.
Over 238 metres, the sprint trip, the run from boxes to finish was essentially a straight dash with one bend at most. Early break speed decided almost everything. Trap 1 gained from saving ground on any slight curve, and a dog that led at the first marker rarely surrendered the position. The window for recovery was too narrow. At this distance, trap draw was arguably more important than at any other trip, because there was simply no time for a slow start or a wide run to be corrected.
At 415 metres — the bread-and-butter distance, the trip that produced the majority of Crayford’s races — the first-bend dynamic took centre stage. That short run to the opening turn compressed the field into a tight cluster, and dogs from traps 4 and 6 benefited from cleaner routes into the bend. Trap 4 runners could angle towards the rail without being baulked. Trap 6 dogs had open space to their outside and only needed to avoid drifting too far wide. Trap 5, wedged between the two, was the consistent underperformer at this trip. A trap 5 runner at 415m often found itself squeezed: wide runners pressing from the right, middle runners cutting across from the left, and no clean line through the traffic.
At 592 metres and beyond, more bends meant more opportunities for positions to change. A dog’s stamina and racing intelligence started to matter alongside its trap speed, and in theory the bias should have flattened. In practice, the Crayford data showed that while the gap between best and worst trap narrowed at middle distances, it never closed entirely. The first bend still set the shape of the race. A dog that lost three lengths to traffic on the opening turn was fighting uphill even over two full laps. What did change at longer distances was the cost of running wide. Trap 6 dogs, who could absorb extra ground over one circuit, paid a steeper price when that extra ground multiplied over two or more laps. The inside positions held slightly more relative value in staying races than they did at the standard trip.
Marathon contests at 946m were rare enough at Crayford that the sample sizes fall short of statistical confidence. Those races involved nearly three full laps of the tight oval, and the dynamics were fundamentally different: tactical positioning in the middle stages mattered as much as the break, and finishers outperformed pace-setters more often than at any other distance. Trap draw still played a role, but at 946m it was one variable among several rather than the dominant factor it was over 238.
Second-Place Patterns: Trap 1 Dominated
Most trap-draw analysis stops at the win column. That is understandable — the win bet is the most common wager, and win percentages are the easiest number to grasp. But at Crayford, the place data told a sharper story. Trap 1 finished second in approximately 20% of all races in the 2019 dataset, a rate that comfortably outstripped every other starting position’s second-place frequency. The red jacket was reaching the frame so consistently that it became one of the most bankable each-way propositions on the card, even in races where it wasn’t winning outright.
The mechanics make this predictable. A trap 1 dog sits directly on the inside rail — the shortest route around every bend. If it breaks well, it leads. If it breaks half a length slow, it can tuck in behind the leaders and hold rail position through the turns, saving ground continuously while wider runners cover extra metres on every curve. In greyhound racing on a compact circuit, a rail-running dog doesn’t need to be the fastest in the field. It just needs to be efficient. The geometry handles the rest.
Compare that to the outside traps in the place statistics. A wide-drawn dog that doesn’t lead the field into the first bend faces a compounding problem: every bend adds extra distance relative to the rail runner, and finishing margins in greyhound racing are measured in half-lengths. A dog running two metres wider on each of four bends has covered eight additional metres across a 415m race. At racing speed, those eight metres equate to roughly half a length — which is precisely the gap between second and fourth on a typical Crayford racecard.
For punters, the place data had direct applications well beyond simple each-way bets. Forecast betting — naming the first two finishers — rewards anyone who can identify consistent place-frame runners. A trap 1 dog with solid form was an obvious candidate for the second line of a straight forecast, paired with whichever dog looked most likely to win from a stronger draw. Reverse forecasts made this even more accessible: backing a trap 1 runner to be involved in the finish without needing to specify the exact order. The structural tendency was clear enough that ignoring it meant leaving money on the table.
The broader lesson from Crayford’s place-finish data is that trap-draw analysis should extend past the winner. A dog’s probability of finishing in the top two or top three is just as relevant as its win rate for the majority of the betting markets that punters actually use. And the biases in those probabilities can be even more pronounced than the headline numbers suggest.
Betting Implications of Trap Data
Knowing that trap 4 won 19% of races at Crayford is only useful if bookmaker prices don’t already fully reflect that edge. If every punter and every pricing algorithm accounts for the bias, the odds on trap 4 runners will be shorter than their form alone warrants, and the value evaporates. The question is not whether a bias exists but whether it is underpriced.
In practice, tissue prices — the initial odds set by a track’s racing manager or an operator’s pricing team — do factor in trap draw, but alongside a dog’s recent calculated time, running style, and the perceived quality of the opposition. Trap draw is one input among several. This means the bias is partially reflected in the market but inconsistently. When a trap 4 dog also has strong recent form, its price tends to be very short and offers little value. When a trap 4 dog has middling figures but faces a weak field from awkward draws, the positional edge might not be fully captured in the odds. That second scenario was where the trap data earned its keep.
The practical approach — applied at Crayford and transferable to any track with documented bias — was to use trap statistics as a filter, not a system. Start by identifying which positions carry a genuine edge at the relevant distance. Then overlay the form: does the dog drawn in the favourable trap have the early speed to exploit it? Is the running style compatible — a railer in trap 1, a middle runner in trap 4? If the form and the draw align, and the price is longer than the implied probability from the trap data, there is a case for a bet. If they conflict — a confirmed wide runner crammed into trap 2, for instance — the trap bias is irrelevant or actively unhelpful. Also read our early pace guide.
Crayford’s closure means no new live betting opportunities at this specific venue. But the analytical framework is portable. Every licensed UK track has its own trap-bias profile, shaped by circumference, bend tightness, surface, and the run to the first turn. Romford, the nearest surviving track to Crayford’s former regulars, has its own distinct patterns. So do Hove, Monmore and Sheffield. The numbers change from one venue to the next. The method does not.